(Case Study)
CourtVisual
A multi-sport app that scores how worth watching tonight's games are, tuned to your taste, then points you to where to watch and how to get in. Built solo, concept to live PWA, on real-time data pipes.
“ESPN tells you the score. A sportsbook tells you the odds. Ticketmaster sells you the seat. None of them tell you whether the game is worth your night.”
The challenge
The idea started at a Mets game. A player was closing in on a record, and the only reason I knew to watch for it was that I happened to be in the building. I wondered whether there was a way to tell fans before a game which ones might be historic, a record in reach, a milestone, a last ride, so they would know to show up. That question grew into a bigger one: not just which games are historic, but which games are worth your night at all.
A fan's question is simple, and nobody answers it: what's worth watching tonight, and where do I watch or go? To answer it today you check ESPN for the schedule, a sportsbook like FanDuel for the odds, a streaming guide for the channel, and Ticketmaster for seats. Four apps, four logins, and not one of them tells you the thing you actually want to know, which is whether the game is worth your night.
The reason the platforms avoid that question is that the answer is subjective. A neutral classic, a bitter rivalry, your team fighting for a playoff spot, a title decider on the line: these are not the same to the same person, let alone to different people. A score that means anything has to weigh the stakes of the game and the taste of the viewer at the same time.
So the find, watch, buy journey stays split across companies that each own one slice and have no reason to connect them. The connective tissue, an honest read that turns raw sports data into a decision, was missing. That gap is the product.
“The score isn't the hard part. Making it honest, and making it yours, is the hard part.
I didn't want a database of games. I wanted a living read on what's worth watching, refreshed from the same pipes the big platforms run on.”
The progression · From PRD to shipped
Proving the idea was the easy part
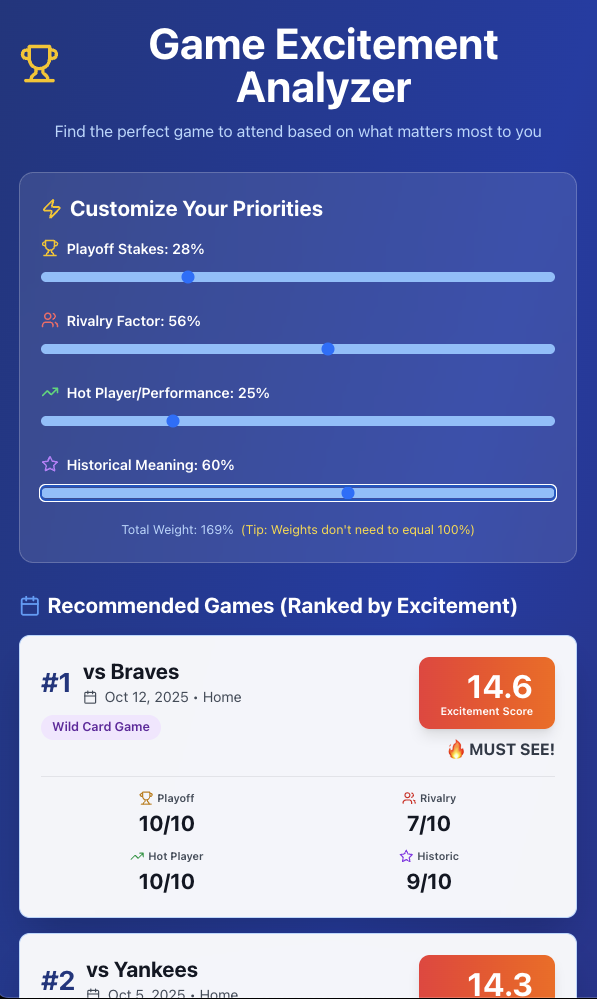
Left to right is the whole arc. I started by writing a full PRD and product vision, and v1 came straight out of it: a Game Excitement Analyzer with raw priority sliders and an uncapped score that ran past 14, on weights that didn't even need to add up. It proved the idea and nothing more.
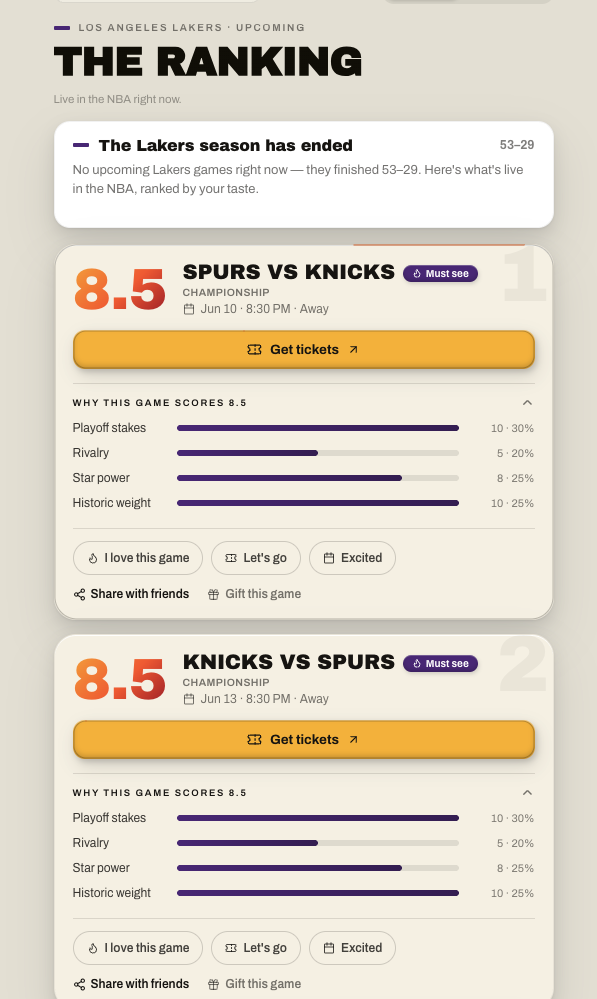
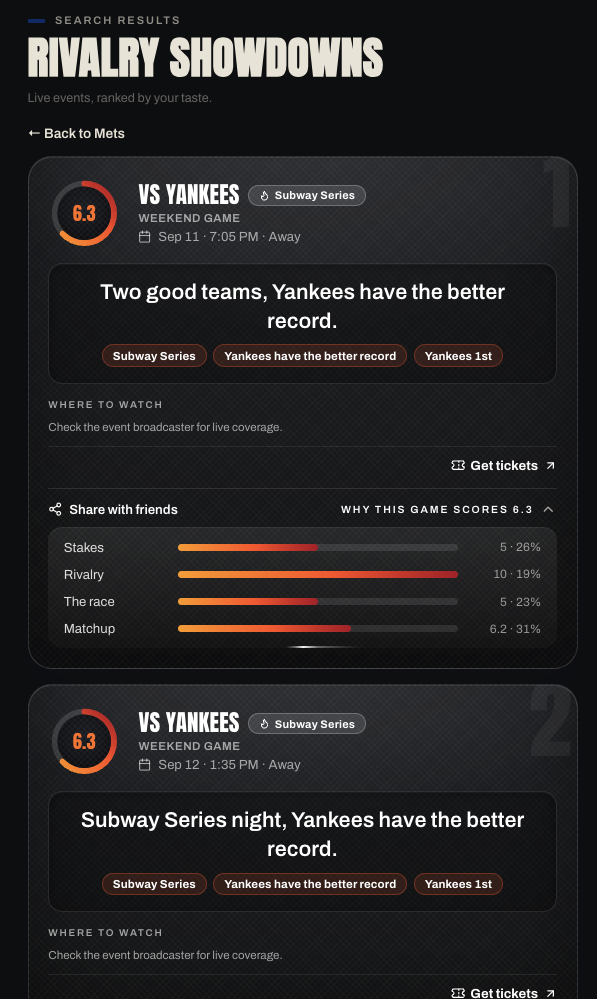
The middle build capped the score to a legible 0 to 10 and turned it into a ranked slate. The third is where it landed: each card carries the four factors a fan actually feels, Stakes, Rivalry, the race, and Matchup, with a plain-English read of why it scored that way.
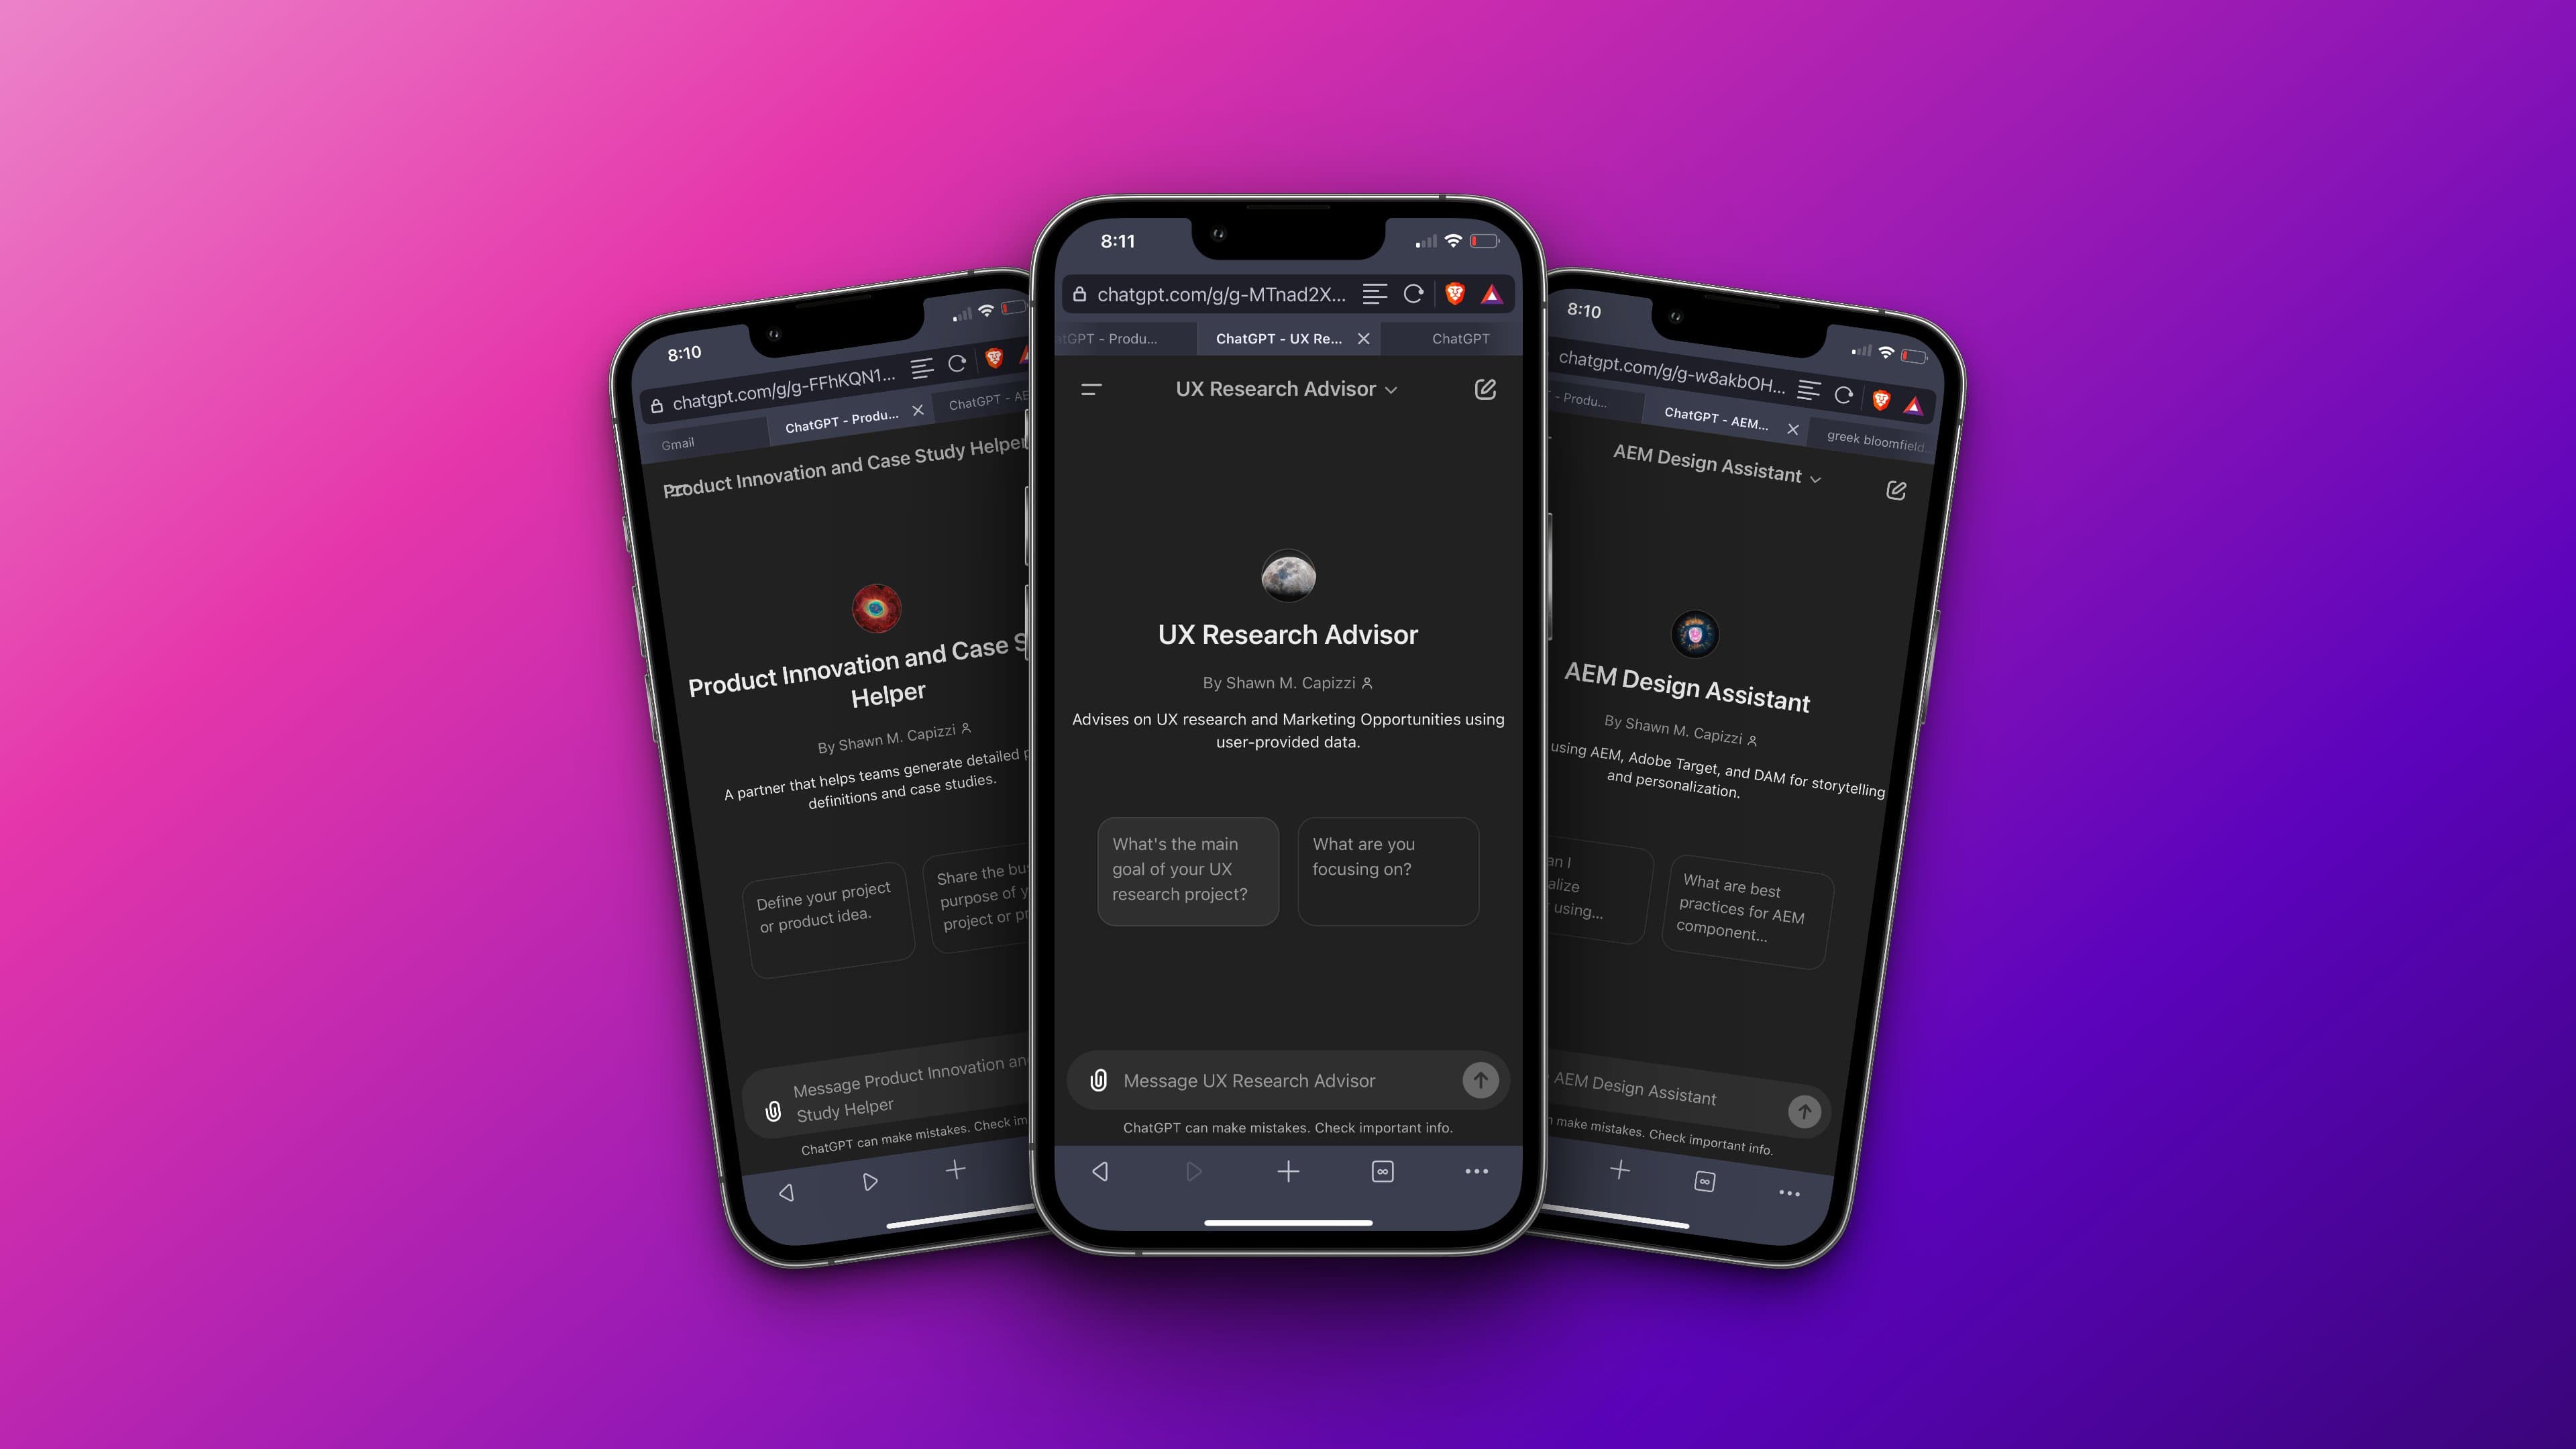
Plenty of people are vibe-coding apps right now. Most lack the business focus and the discipline to stay on real value and a user-first point of view, so they ship something oversaturated and purposeless. I built this with Claude Code and ChatGPT, but I stayed the orchestrator: I described what I wanted to happen and what I wanted to see, in screenshots, text, and micro-interaction notes, and directed the tools until it matched the picture in my head. Miss on the first pass, and it landed by the second or third.
AI, if told, will keep building whatever features you ask it to, forever. My job as an orchestrator and the human crafting the experience is to have judgment and pull from my experience. That includes going back and trimming, defining the visual hierarchy, the design and pattern system, deciding how a user with zero context gets onboarded, which features earn their place, and which surprises people get to discover, keep, or switch off. That editing is the product.
I started with the score. I broke excitement into a few factors a fan already feels: the stakes (playoff and championship weight), the rivalry, the race (how live the standings and the matchup are), and the matchup history. Every game gets a 0 to 10 score and a plain-English verdict, from “good game” up to “hottest ticket.” The math is explainable on purpose. A fan should be able to see why a game scored the way it did, not just trust a number.
Then I fed it from live pipes instead of a static list. v1 was a hand-built slate, useful for proving the idea and nothing more. The live app pulls fixtures, scores, and standings from ESPN's feeds, derives competitiveness from moneyline odds through The Odds API, resolves where to watch from broadcast data, and links the ticket path through Ticketmaster. The score is a living read on tonight, refreshed from the same kind of data the big platforms sit on, not a snapshot I curated by hand.
Most of the refinement work was making the score honest against real data. The 2026 World Cup feed forced the hard calls: fixtures come first, so a match exists whether or not tickets are listed yet; knockout rounds carry a stakes floor; competitiveness is derived from the odds rather than asserted. When I added player follows, the language stayed honest too. The app surfaces “Messi's Argentina,” never a promise that Messi will start, because lineups aren't set until kickoff. The credibility of the whole thing rests on not overclaiming.
I also made the score yours. A neutral-fan baseline keeps the ranking fair, then the viewer tunes what counts with sliders and presets, and follows teams, sports, players, and a home city. The same slate reorders for a Knicks die-hard, a neutral League Pass watcher, and someone who only follows Messi. It's personalization that actually changes the ranking, not a cosmetic filter on top of it.
Then I built the experience around the data, which is the part most data products skip. CourtVisual runs on one restrained design system so the supporting surfaces, onboarding, settings, loading, empty states, get out of the way, while the data-rich game card stays rich. That is the same instinct I bring to client work: the experience architecture around the model is the actual product, and the model is just an ingredient.
Live data · Not a static list
Scored from live pipes, and find, watch, buy on one card
The slate is built from real-time feeds, not a database I maintain by hand: ESPN for fixtures, scores, and standings; The Odds API for the moneyline that competitiveness is derived from; broadcast data for where to watch; Ticketmaster for the ticket path. The score re-reads as the night develops.
That's also where the market position lives. The same card that tells you a game is worth watching tells you where to watch it and how to get in, the three jobs a fan currently splits across ESPN, a sportsbook, a streaming guide, and Ticketmaster, collapsed into one decision.

Built for the moment · 2026 World Cup
The World Cup, live and in its own colors
The tournament feed is fixtures-first, pulled from ESPN, so a match shows up the moment it's scheduled, independent of whether tickets are listed yet. Knockout rounds carry a stakes floor, and competitiveness comes from the live odds.
Each card wears both nations' federation crests and team color. The color is run through a luminance floor so the navy and near-black kits that would normally vanish on a dark card stay legible, the kind of detail that separates a real product from a feed wrapped in a template.

Under the hood · The build, not just the screens
I found the pipes, then wired them
A scoring product is only as trustworthy as the data under it. I used AI to research which feeds even existed and what each one could give me, then I architected the data layer and directed the build. Each fan's state, their teams, sliders, and follows, lives in Supabase behind row-level security, so a row is readable only by the person it belongs to: a policy enforced at the database, not a setting in a dashboard. I decided what it had to guarantee; the tools wrote and rewrote the SQL until it did.
The live feeds are wired the same way, ESPN for fixtures and standings, The Odds API for the moneyline competitiveness comes from, Ticketmaster for the ticket path, each keyed server-side and deployed continuously on Vercel. I directed the integrations and debugged the edges, the tools moved fast through the boilerplate, and the architecture, what connects to what and what the score is allowed to claim, stayed my call. The screens get the attention. This is the part that makes the number mean something.

Selected outcomes
A live, multi-sport excitement engine
Every game scored 0 to 10 from real-time data, each with a plain-English verdict. A living read on tonight, not a static list of fixtures.
Personalization that reorders the slate
Presets, per-factor sliders, and follows for teams, sports, players, and a city. The same games rank differently for a die-hard, a neutral, and a single-player fan.
Find, watch, and buy, unified
The excitement read, where to watch, and the ticket path on one card. A journey that's split across ESPN, sportsbooks, streaming guides, and Ticketmaster today.
Shipped for a live moment, the 2026 World Cup
A fixtures-first tournament feed with per-team federation crests and luminance-safe color, plus honest, team-level player follows.
A design system that scales calm
One restrained system across onboarding, settings, loading, and empty states, so the data-rich game card stays the star instead of the chrome.
Concept to live PWA in 50 to 60 hours
Product design and AI-assisted full-stack engineering, on Next.js, Supabase, and Vercel. Designed, built, and shipped solo in roughly 50 to 60 hours of focused work, deployed continuously from v1 to a mature tool.
The big platforms each own a slice of the fan's night and have no reason to connect them. The opportunity was never more data. It was the connective tissue, the honest read that turns data into a decision.
CourtVisual is one person defining the product, doing the research, connecting the pipes, refining the UI, and shipping it, all of it solo. Now picture that same person inside your walls, with your data, your team, and real users in the room. That is what a strategist and designer looks like now: someone who folds AI in for the economics and the speed to market without giving up the judgment that decides whether a thing is worth shipping.
That's the proof. That's what I bring into client engagements.
Building a product that turns live data into a decision?
Related work
Continue reading
Solo · AI Native Design Lab
Building an AI-native product design lab
A working AI-native product design practice. UXR tools, prototype agents, healthcare-first applications.
Multi-Brand · 3x Design Systems · Governance
Building digital governance across 70+ therapeutic brands
$3.5M+ in digital transformation. Industry-first mobile wallet integration for patient medication information.